Mobility Data, Feature Engineering and Hierarchical Clustering
The United States has one of the world’s largest automobile markets, second only to China. With 270.4 million registered vehicles as of 2017 on the American roads, there are millions of crashes every year. According to the National Highway Traffic Safety, there were an estimated 7 million police-reported motor vehicle crashes in the US in 2016. This led to about 207 million dollars in collision loss in 2016. Being able to predict the likelihood of a driver filling a claim in the coming months provides the insurer with the ability to adjust premiums and plan the provisions ahead of time.
Applying predictive analytics to insurance claim is nothing new, however we are witnessing a transition from classical, static and general data-based models (driver age, driver license age, car type, etc.) to models based on actual driving-behavior (sudden braking and other sorts of unusual driving behavior indicators).
This transition is mainly driven by the emergence of big data frameworks and their ability to manipulate and analyze larger and less structured data sets. This has led some companies to start collecting data related to driving patterns by using the devices installed by insurance companies in the insured person’s car.
Feature Engineering
While a number of devices exist to monitor and log data provided by the car, there are large disparities in the quality of the data elements available between older and newer models. Therefore, in a given insurer’s portfolio, a large portion of the collected data may contain much less information and the data is very in-homogeneous. Engineering a set of informative driver features to feed ML models in this context is a real challenge; It’s time to think beyond direct data…
Number of records at our disposal was about
The total number of records at our disposal was about 123 millions of records representing trips of only two thousand individuals over diverse time periods ranging from a month up 18 months.
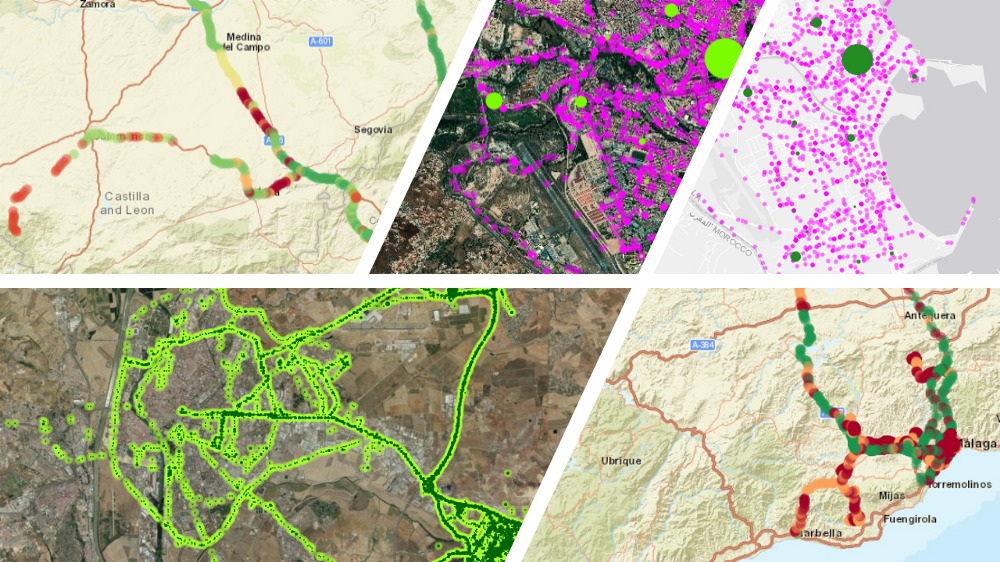
One other thing that is worth looking at is the area covered when traveling and decipher drivers that have many short local trips versus long “straight line” trips of many km. This goes beyond the usual automatic features engineering, and requires concepts of mobility research such as radius of gyration, maximum area covered, mobility predictability based on entropy and others . Of course, all the above quantities are then looked at on different time periods scales (such as week, days, months) and summarized (mean, standard deviations, kurtosis of degree 1,2,3..) in order to create a set of more than 500 features.
To refine our modelling, we also took advantage of the many external data sources available online, through the use of public APIs. For instance, we included information on sunrise/sunset hours to determine night driving. The public meteorological institutions give (In Spain, where the study was conducted, one can access this information at http://www.aemet.es/es/datos_abiertos/AEMET_OpenData) access to historical data of rain, wind and temperature at different points in the geography that we also included in order to model driving conditions.
Openstreetmaps provides, among many other data, speed limits for some roads at different points (though some care must be taken as it is a publicly contributed database and thus integrity of data must be checked). Used along with Data provided by google maps Geocoding API and Wikipedia it allows to determine the name of the roads and if they are highways or urban areas. All this data helps to build a more detailed profile of the driver, independently of the data the car is able to provide. In the end, including both features coming from the car measurements itself and the ones constructed from public data, we constructed a set of 1200 features that were fed to our ML models.
One way to go beyond direct mobility measurements (distance, speed…) is to think in terms of people routines. That is to say, moving from a physical domain approach (how many kilometers you travel, at what speed) to a symbolic domain approach (what places you visit, how often…). For instance, two individuals can travel 10 km a day while exhibiting very different behavior; for instance, one of them might commutes from home to work and back, whereas the another one goes to the gym, then to work, then to his children school, and then home again. Therefore, these two individuals, despite having the same physical domain profile, exhibit a very different symbolic domain profile. Another example could be that of two individuals travelling to 5 different places a day, one of them travelling to the exact same 5 locations, whereas the other one would be visiting the same two places everyday and alternating between the other three from day to day.
The key concept here, is the individual predictability, or the way around his randomness. If one individual visits 5 different places in one day, whereas a second individual visits only 2 places, the first individual is more random in that his movement history encloses a higher uncertainty (if one has to guess where the first individual is, the likelihood of getting it right is 1/5=0.2 while for the other one it is 1/2=0.5).
«Think in terms of peoples routines»
Now the question is, how do we summarize these dimensions of human mobility? One concept that beautifully captures the level of randomness in a sequence of events is found in the domain of information theory and is known as entropy. Shannon entropy takes into account the distribution of the events in the sequence, and provides a value representing the “expected surprise” or uncertainty enclosed by a random variable (the sequence of visited locations in our case). When all values of the random variable have the same probability of occurrence, then Shannon entropy reaches its maximum value, also known as Hartley entropy.
For our model, we included the raw value of Shannon entropy as well as normalized by the Hartley entropy for the sequences of visited and stop points aggregated per day, week, weekday, weekend and month (points where the individual stopped for more than 30 minutes).
Hierarchical Clustering
In this specific problem, one key point in being able to augment the data set with external sources is to be able to filter down the number of data points. Indeed, as mentioned earlier, logs span more than a year in average and data points are recorded about every 30 seconds (in the best case) which leads to millions of data points for each driver. Due to limits on the number of calls to the different APIs and the time it would take to process the HTTP request it is not feasible to obtain the information for every single points in the dataset. The question is then how to select the best points for which fetch this information?
The way we solved this particular issue is through clustering. However, there exists a wide variety of clustering algorithms, so the next question is which one to use?
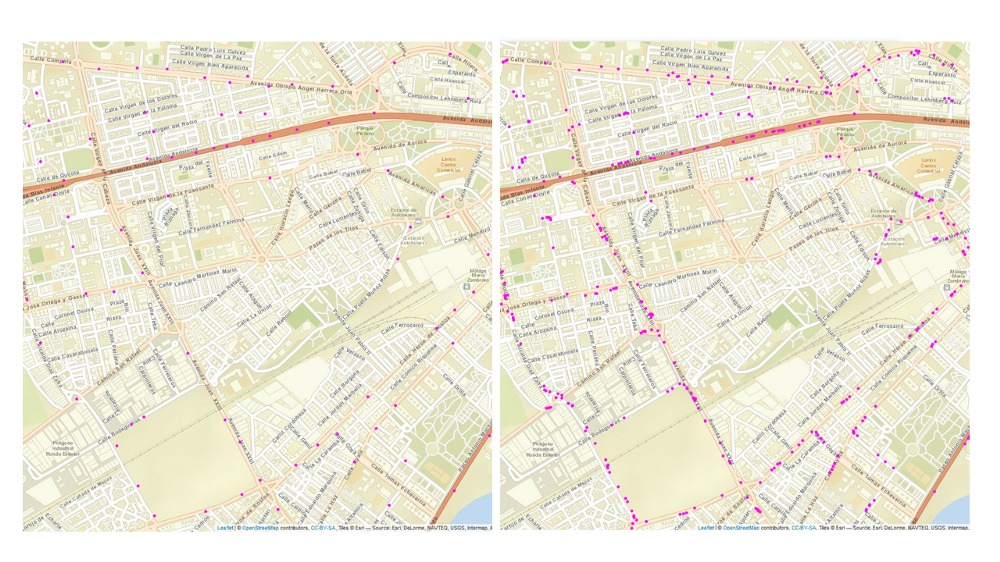
Needless to say, that having 2,000 different drivers, scattered through Spanish geography, and carrying different data collecting devices leads to having different locations histories, where the clustering need to make sense. For that reason, it was a challenged to work with algorithms depending on predefined parameters since these needed to be adjusted to each different case. For this reason we discarded plain clustering techniques, such as k-NN because we cannot know the final number of clusters. Density-based clustering algorithms were discarded as well because they turned out to be quite sensitive to the hyperparameters. To illustrate this, we ran some tests for which we show results in the images below. In the left image, we see the result of clustering the trips of a user using HDBSCAN, a density-based algorithm, with a minimum number of points per cluster equal to 2, and a minimum distance equal to 10, whereas in the right image the parameters are changed to 10 and 10 respectively. As can be seen, there is a huge difference between the results, just for this particular driver and area of a city. Thus, density-based algorithms were discarded since it would require tuning a different set of parameters for each driver in every scenar
Finally, we turned to hierarchical clustering instead. This family of algorithms needs just the maximum distance between points of a cluster to perform their task, which we set to 100 m for all drivers, since this is the granularity we wanted to reflect the trip of drivers. No other parameter needed to be set, nor final number of cluster or number of points per cluster. Among the different hierarchical clustering algorithms, we focused only on two of them due to memory constraints: CLINK and SLINK. The main difference between the two is how to calculate the distance between clusters: SLINK measures the distance between the closest points of two former clusters to decide whether to merge them or not, whereas CLINK measures the distance between the furthest away points. This way, CLINK is better suited for our purposes so that we are sure no two points are furthest away than the threshold (with SLINK, the closest points of the two merged clusters are below the threshold of 100 m, but we have no clue of what happens with the rest of the points of both clusters, which could be much further away, thus covering different streets or roads with different speed limits or road type).
The image below illustrates the kind of results we can achieve using CLINK for our problem. The image on the left hand side represents the clustered positions of a specific driver while the one on the right hand side is the original image with all the collected positions. One can see that the clustering allows us to considerably reduce the number of points with minimal loss of information as all the trips and roads taken can still be identified.
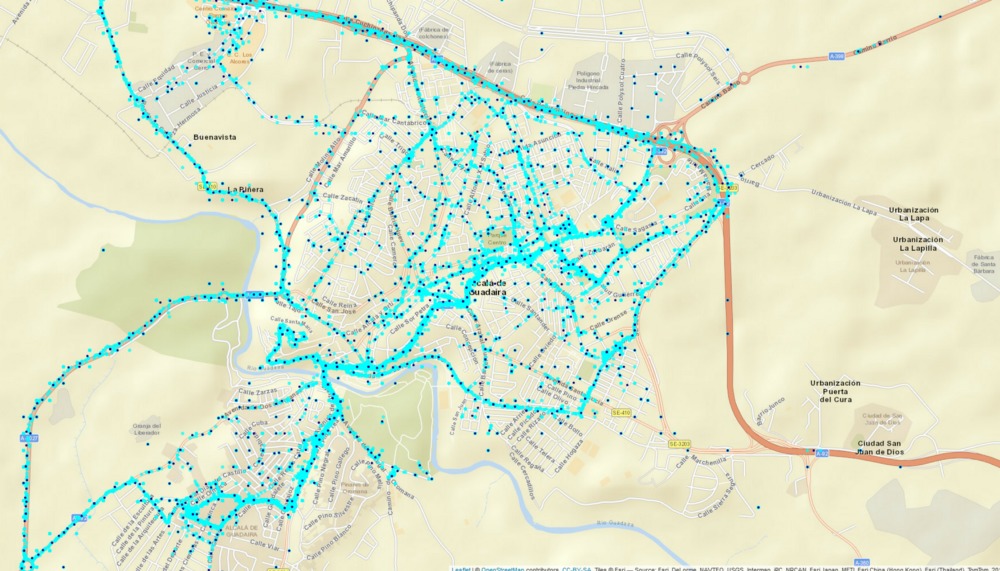
Using CLINK algorithm allows us to cluster nearby points diminishing the redundancy while preserving different granularity at urban level (closer data points are needed to profile the displacements across the city) and at highway level (changes are less frequent both in speed and acceleration allowing for greater removal of redundancy without loss of accuracy). In addition, we introduced spatial indexes in the databases in order to efficiently share geographical information across drivers. This allows for instance to extrapolate the type of road and speed limit to drivers’ trips having very similar coordinates which in a sense amounts to clustering among different drivers.
Conclusion
The key to successfully derive predictive analytics from real life scenarios is often more about the data than the sophistication of the algorithm . It is about being creative, and being able to extract innovative attributes that reveal the complexity of the data. Only then, modelling algorithms will be able to exploit the full potential of the data and deliver the best predictions.


This work was made by Alicia Rodríguez, Senior Data Scientist at GDSModellica and Florian Lyonnet, Chief Data Scientist at GDSLINK.
Últimos Árticulos

Gestión integral y visión holística de la banca digital para aproximarse al cliente
Gestión integral y visión holística de la banca digital para aproximarse al cliente Nota de

Características del ciclo de vida del cliente en un entorno digital
Características del ciclo de vida del cliente en un entorno digital Nota de PrensaMadrid, 11

La encrucijada de la banca entre el futuro y sus clientes
La encrucijada de la banca entre el futuro y sus clientes GDS Modellica Sabemos que